Simple OMF/OML iperf experiment
This simple tutorial presents all the basic steps to develop, run, and access the result of a wireless network experiment with OMF6 and OML2.
This tutorial is based on UTH NITlab scenario (Wi-Fi) - adapted to use with FIT-NITOS Paris platform and portal.onelab.eu
Experiment Description
This experiment involves two resources of type PC with wireless capabilities: node 1 and node 2.
Node 1 is running a simple iperf client application while Node 2 is running a simple iperf server application
Node 1 is the “Sender” and will generate and send traffic to the “Receiver” node 2, over a wireless (IEEE 802.11g) channel.
We will use oml_iperf as a traffic generator and bandwidth measurement tool. It provides generators producing various forms of packet streams and port for sending these packets via various transports, such as TCP and UDP.
The oml_iperf is a wrapper around the traditional iperf application. It captures the outputs and sends them as measurement streams to an OML2 collection point (an OML2 server in this case), which then stores them in a database available to the experimenter.
Prerequisites
Provisioning and accessing resources
Before starting this tutorial, please make sure that you have completed the following:
- You need to have active account on the OneLab portal (to create an account please follow this tutorial: User sign-up)
- You need to create or join existing project (Please follow this tutorial: Lab)
- You need to create or join existing slice within the project (Please follow this tutorial: Experiment )
- You need to reserve one node on FIT NITOS Paris (to know how to reserve node please follow this tutorial: reservation-with-scheduling-label)
- You have SSH client installed (on OSX and Linux the terminal clients are available by default, on Windows you can donwload and install Putty). Alternatively if you are using FireFox you can install this plugin to run shell within browser. See more here: Accessing reserved resources
Experiment Controller (EC)
The OMF Experiment Controller (EC) is the software that will interpret your Experiment Description (ED) and interact with the resources to execute it accordingly. You can run your experiment directly from EC installed on our gateway server (in this case please skip this section) or you can install EC on your own machine by following this tutorial: OMF 6 Installation Guide.
OML 2 server (OML2)
We will collect all data from our experiment using OML server. You can install your own server or you can use one provided by UTH: http://nitlab.inf.uth.gr/phppgadmin/
Preparing an experiment
In order to run an experiment using OMF, you first need to describe it with an Experiment Description (ED). An ED is a file/script that is supplied as an input to the Experiment Controller (EC). It contains a detailed description of the resources involved in the experiment and the sets of actions to perform in order to realize that experiment. An ED is written using the OMF Experiment Description Language (OEDL). You can click here to know more about (OMF6-OEDL).
In this tutorial we will use already prepared ED file. Please follow the comments to understand the code. Please update this code with node name that you have reserved.
1 2 3 4 5 6 7 8 9 10 11 12 13 14 15 16 17 18 19 20 21 22 23 24 25 26 27 28 29 30 31 32 33 34 35 36 37 38 39 40 41 42 43 44 45 46 47 48 49 50 51 52 53 54 55 56 57 58 59 60 61 62 63 64 65 66 67 68 69 70 71 72 73 74 75 76 77 78 79 80 81 82 83 84 85 86 87 88 89 90 91 92 93 94 95 96 97 98 99 100 101 102 103 104 105 106 107 108 109 110 111 112 113 114 115 116 117 118 119 120 121 122 123 124 125 126 127 128 129 130 131 132 133 134 135 136 137 138 139 140 141 142 143 144 145 146 147 148 149 150 151 152 153 | defApplication('iperf', 'iperf') do |a|
a.binary_path = "/usr/bin/oml2-iperf"
# a.description = <<TEXT
# Iperf is a traffic generator and bandwidth measurement tool. It provides
# generators producing various forms of packet streams and port for sending these
# packets via various transports, such as TCP and UDP.
# TEXT
a.defProperty('interval', 'pause n seconds between periodic bandwidth reports', '-i', {:type => :string, :dynamic => false, :default => '1.0'})
a.defProperty('len', 'set length read/write buffer to n (default 8 KB)', '-l', {:type => :string, :dynamic => false})
a.defProperty('print_mss', 'print TCP maximum segment size (MTU - TCP/IP header)', '-m', {:type => :boolean, :dynamic => false})
a.defProperty('output', 'output the report or error message to this specified file', '-o', {:type => :string, :dynamic => false})
a.defProperty('port', 'set server port to listen on/connect to to n (default 5001)', '-p', {:type => :integer, :dynamic => false})
a.defProperty('udp', 'use UDP rather than TCP', '-u', {:order => 2, :type => :boolean, :dynamic => false})
a.defProperty('window', 'TCP window size (socket buffer size)', '-w', {:type => :integer, :dynamic => false})
a.defProperty('bind', 'bind to host, an interface or multicast address', '-B', {:type => :string, :dynamic => false})
a.defProperty('compatibility', 'for use with older versions does not sent extra msgs', '-C', {:type => :boolean, :dynamic => false})
a.defProperty('mss', 'set TCP maximum segment size (MTU - 40 bytes)', '-M', {:type => :integer, :dynamic => false})
a.defProperty('nodelay', 'set TCP no delay, disabling Nagle\'s Algorithm', '-N', {:type => :boolean, :dynamic => false})
a.defProperty('IPv6Version', 'set the domain to IPv6', '-V', {:type => :boolean, :dynamic => false})
a.defProperty('reportexclude', '[CDMSV] exclude C(connection) D(data) M(multicast) S(settings) V(server) reports', '-x', {:type => :string, :dynamic => false})
a.defProperty('reportstyle', 'C or c for CSV report, O or o for OML', '-y', {:type => :string, :dynamic => false})
a.defProperty('server', 'run in server mode', '-s', {:type => :boolean, :dynamic => false})
a.defProperty('bandwidth', 'set target bandwidth to n bits/sec (default 1 Mbit/sec)', '-b', {:type => :string, :dynamic => false, :unit => "Mbps"})
a.defProperty('client', 'run in client mode, connecting to host', '-c', {:order => 1, :type => :string, :dynamic => false})
a.defProperty('dualtest', 'do a bidirectional test simultaneously', '-d', {:type => :boolean, :dynamic => false})
a.defProperty('num', 'number of bytes to transmit (instead of -t)', '-n', {:type => :integer, :dynamic => false})
a.defProperty('tradeoff', 'do a bidirectional test individually', '-r', {:type => :boolean, :dynamic => false})
a.defProperty('time', 'time in seconds to transmit for (default 10 secs)', '-t', {:type => :integer, :dynamic => false})
a.defProperty('fileinput', 'input the data to be transmitted from a file', '-F', {:type => :string, :dynamic => false})
a.defProperty('stdin', 'input the data to be transmitted from stdin', '-I', {:type => :boolean, :dynamic => false})
a.defProperty('listenport', 'port to recieve bidirectional tests back on', '-L', {:type => :integer, :dynamic => false})
a.defProperty('parallel', 'number of parallel client threads to run', '-P', {:type => :integer, :dynamic => false})
a.defProperty('ttl', 'time-to-live, for multicast (default 1)', '-T', {:type => :integer, :dynamic => false})
a.defProperty('linux-congestion', 'set TCP congestion control algorithm (Linux only)', '-Z', {:type => :boolean, :dynamic => false})
a.defMeasurement("application") do |m|
m.defMetric('pid', :long, 'Main process identifier')
m.defMetric('version', :string, 'Iperf version')
m.defMetric('cmdline', :string, 'Iperf invocation command line')
m.defMetric('starttime_s', :long, 'Time the application was received (s)')
m.defMetric('starttime_us', :long, 'Time the application was received (us)')
end
a.defMeasurement("settings") do |m|
m.defMetric('pid', :long, 'Main process identifier')
m.defMetric('server_mode', :long, '1 if in server mode, 0 otherwise')
m.defMetric('bind_address', :string, 'Address to bind')
m.defMetric('multicast', :long, '1 if listening to a Multicast group')
m.defMetric('multicast_ttl', :long, 'Multicast TTL if relevant')
m.defMetric('transport_protocol', :long, 'Transport protocol (IANA number)')
m.defMetric('window_size', :long, 'TCP window size')
m.defMetric('buffer_size', :long, 'UDP buffer size')
end
a.defMeasurement("connection")do |m|
m.defMetric('pid', :long, 'Main process identifier')
m.defMetric('connection_id', :long, 'Connection identifier (socket)')
m.defMetric('local_address', :string, 'Local network address')
m.defMetric('local_port', :long, 'Local port')
m.defMetric('foreign_address', :string, 'Remote network address')
m.defMetric('foreign_port', :long, 'Remote port')
end
a.defMeasurement("transfer") do |m|
m.defMetric('pid', :long, 'Main process identifier')
m.defMetric('connection_id', :long, 'Connection identifier (socket)')
m.defMetric('begin_interval', :float, 'Start of the averaging interval (Iperf timestamp)')
m.defMetric('end_interval', :float, 'End of the averaging interval (Iperf timestamp)')
m.defMetric('size', :long, 'Amount of transmitted data [Bytes]')
end
a.defMeasurement("losses") do |m|
m.defMetric('pid', :long, 'Main process identifier')
m.defMetric('connection_id', :long, 'Connection identifier (socket)')
m.defMetric('begin_interval', :float, 'Start of the averaging interval (Iperf timestamp)')
m.defMetric('end_interval', :float, 'End of the averaging interval (Iperf timestamp)')
m.defMetric('total_datagrams', :long, 'Total number of datagrams')
m.defMetric('lost_datagrams', :long, 'Number of lost datagrams')
end
a.defMeasurement("jitter") do |m|
m.defMetric('pid', :long, 'Main process identifier')
m.defMetric('connection_id', :long, 'Connection identifier (socket)')
m.defMetric('begin_interval', :float, 'Start of the averaging interval (Iperf timestamp)')
m.defMetric('end_interval', :float, 'End of the averaging interval (Iperf timestamp)')
m.defMetric('jitter', :float, 'Average jitter [ms]')
end
a.defMeasurement("packets") do |m|
m.defMetric('pid', :long, 'Main process identifier')
m.defMetric('connection_id', :long, 'Connection identifier (socket)')
m.defMetric('packet_id', :long, 'Packet sequence number for datagram-oriented protocols')
m.defMetric('packet_size', :long, 'Packet size')
m.defMetric('packet_time_s', :long, 'Time the packet was processed (s)')
m.defMetric('packet_time_us', :long, 'Time the packet was processed (us)')
m.defMetric('packet_sent_time_s', :long, 'Time the packet was sent (s) for datagram-oriented protocols')
m.defMetric('packet_sent_time_us', :long, 'Time the packet was sent (us) for datagram-oriented protocols')
end
end
defGroup('Receiver', 'node031') do |node|
node.addApplication("iperf") do |app|
app.setProperty('port', 5200)
app.setProperty('server', true)
app.setProperty('interval', '1')
app.measure('transfer', :interval => 1)
end
node.net.w0.mode = "adhoc"
node.net.w0.type = 'g'
node.net.w0.channel = "6"
node.net.w0.essid = "helloworld"
node.net.w0.ip = "192.168.0.3/24"
end
defGroup('Sender', 'node030') do |node|
node.addApplication("iperf") do |app|
app.setProperty('port', 5200)
app.setProperty('client', "192.168.0.3")
app.setProperty('time', 30)
app.setProperty('bandwidth', '50000000')
end
node.net.w0.mode = "adhoc"
node.net.w0.type = 'g'
node.net.w0.channel = "6"
node.net.w0.essid = "helloworld"
node.net.w0.ip = "192.168.0.2/24"
end
onEvent(:ALL_UP_AND_INSTALLED) do |event|
info "This is my first OMF experiment with iperf"
after 1 do
group('Receiver').startApplications
info "Server has started now..."
end
after 3 do
group('Sender').startApplications
info "Client has started now..."
end
after 34 do
allGroups.stopApplications
info "All my Applications are stopped now."
Experiment.done
end
end
# Local Variables:
# mode:ruby
# vim: ft=ruby:sw=2
# End:
|
Running an experiment
To run your experiment you need to have Experiment Controler (EC) installed and configured. As mentioned before you can always use EC installed by us on testbed gateway server: paris.fit-nitos.fr. We will follow this aproach in this tutorial.
Accessing your account on the gateway server
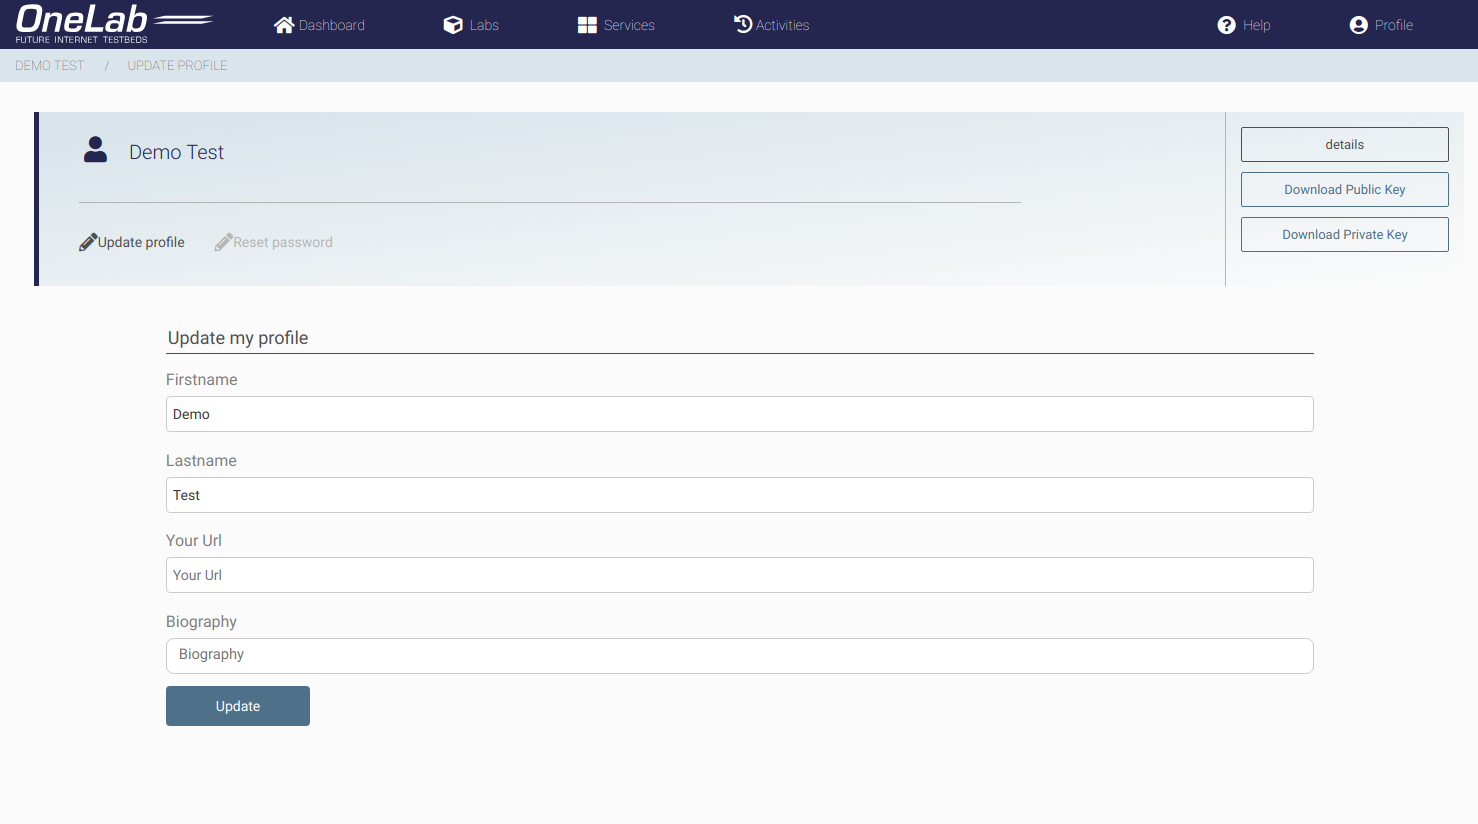
- Download SSH private key form the portal that was generated for you during account creation:
- login to portal,
- In your profile, click “Download Private Key” button.
If you have an active Nitos/OMF reservation, go to portal dashboard and under Your current reservation, click “Go to your reservation”. You will be redirected to your Nitos Experiment.
Your user-specific SSH command will appear in this page. This command will let you access through SSH to the resources
NOTE: You need to have SSH client installed (on OSX and Linux the terminal clients are available by default, on Windows you can donwload and install Putty). Alternatively you may also run shell within browser (Mozilla Firefox or Google Chrome only). To know how to access your reserved nodes on different Operating Systems please follow this tutorial: Accessing reserved resources
Cleaning up the environment
NITOS nodes are Ubuntu based PC’s with enabled Wi-Fi cards. You should start your experiment with installing clean copy of Ubuntu OS. To achieve this please run the command:
omf load -i baseline.ndz -t nodeXX #loading OMF enabled Ubuntu OS image on the nodeXX (replace nodeXX with node name that you have reserved)
At any time you can turn on the node and connect to it with standard ssh command (no authorisation is required):
omf tell -a on -t nodeXX # turn on the nodeXX
ssh root@nodeXX  # XX should be replaced by the node number
Than you can install on the node any new software you like. However when the reservation period will expire we don’t remove the software installed by user. For this reason before running your experiment we asked you to install clean copy of Ubuntu OS.
Hint: If you install some specific software on the node and you would like to preserve your work you can always save whole disk image into the file (you can skip this during our tutorial and go directly to “Running your ED script from EC” section).
omf save -n nodeXX #saving OMF image for the nodeXX
The image will be stored in /home/images on the gateway server (example file: root-node-node11.paris.fit-nitos.fr-25_11_2014_14:57.ndz). In addition you can deploy the same image on all nodes that you have reserved:
omf load -i root-node-node11.paris.fit-nitos.fr-25_11_2014_14:57.ndz -t nodeXX,nodeZZ,nodeYY #loading OMF image on the nodeXX, nodeZZ, nodeYY
To know more options please run command:
omf load
Running your ED script from EC
On the gateway server copy-paste the script to file paris_tutorial001.rb or download
ED_scriptUpdate the ED file with your reserved node name (using nano or vim)
nano paris_tutorial001.rb
Start the EC software and tell it to execute the experiment described in your ED file, using the command line:
omf_ec -u xmpp://usr:pwd@my_xmpp.com exec paris_tutorial001.rb- replace xmpp://usr:pwd@srv with the credentials for your user on the xmpp pubsub server that is used to communicate with the resources:
omf_ec -u xmpp://griffin.ipv6.lip6.fr exec paris_tutorial001.rb
If you would like to know more about the other options of the OMF EC software please run the commands:
omf_ec help
omf_ec help exec
Understanding the output
Below is the example output from the experiment that we have defined and run as part of this experiment:
- At first the EC provides us with some information about the parameters of this experiment:
OMF Experiment Controller - Copyright (c) 2012-13 National ICT Australia Limited (NICTA)
{:type=>:xml, :authenticate=>nil}
17:11:56 INFO  XMPP::Communicator: Connecting to 'griffin.ipv6.lip6.fr' ...
17:11:56 INFO  XMPP::Communicator: Connected
17:11:56 INFO  Object: OMF Experiment Controller 6.1.1 - Start
17:11:56 INFO  Object: Connected using {:proto=>:xmpp, :user=>"griffin-18963", :domain=>"griffin.ipv6.lip6.fr"}
17:11:56 INFO  Object: Execute: /home/onelab.upmc.nitos_tut.nitos/tut02.rb
17:11:56 INFO  Object: Properties: {}
17:11:56 WARN  Context::AppContext: No OML URI configured for measurement collection! (see option 'oml_uri'). Disabling OML Collection for 'transfer'.
17:11:56 INFO  OmfEc::Experiment: Experiment: 2015-06-01T15:11:56.496Z starts
17:11:57 INFO  OmfEc::Experiment: Configure 'node11' to join 'Receiver'
17:11:57 INFO  OmfEc::Experiment: Configure 'node12' to join 'Sender'
- It also provides us some feedback about its communication with the XMPP server and other OMF entities:
17:11:57 INFO  OmfEc::Experiment: Newly discovered resource >> xmpp://node12@griffin.ipv6.lip6.fr
17:11:57 INFO  OmfEc::Experiment: Newly discovered resource >> xmpp://node11@griffin.ipv6.lip6.fr
17:11:57 INFO  OmfEc::Experiment: Config xmpp://node12@griffin.ipv6.lip6.fr to join Sender
17:11:57 INFO  OmfEc::Experiment: Config xmpp://node11@griffin.ipv6.lip6.fr to join Receiver
17:11:58 INFO  OmfEc::Experiment: Newly discovered resource >> xmpp://6a9228d3-f2fc-40b0-a7d8-e56b63e823e8@griffin.ipv6.lip6.fr
17:11:58 INFO  OmfEc::Experiment: Newly discovered resource >> xmpp://b97dd7c1-fc70-4795-b7bb-b44d14e8eaf3@griffin.ipv6.lip6.fr
17:11:59 INFO  OmfEc::Experiment: Newly discovered resource >> xmpp://49bc7e63-745f-4aa1-98f8-dcd1c018ddc9@griffin.ipv6.lip6.fr
- Then it also informs us when a defined event has been triggered:
17:11:57 INFO  OmfEc::Experiment: Event triggered: 'ALL_NODES_UP, ALL_UP'
17:12:00 INFO  OmfEc::Experiment: Event triggered: 'ALL_UP_AND_INSTALLED'
- Finally, when an event is triggered (such as ALL_UP_AND_INSTALLED), it informs us about the tasks executed for that event, and their results/outputs:
17:12:00 INFO  Object: This is my first OMF experiment with iperf
17:12:00 INFO  OmfEc::Experiment: Newly discovered resource >> xmpp://bacb21f9-b523-4ffa-bc7c-eb0d7a5b5785@griffin.ipv6.lip6.fr
17:12:01 INFO  Object: Server has started now...
17:12:01 INFO  OmfEc: APP_EVENT STARTED from app iperf_cxt_0 - msg: env -i /usr/bin/oml2-iperf -s -p 5200
17:12:02 INFO  OmfEc: APP_EVENT STDOUT from app iperf_cxt_0 - msg: ------------------------------------------------------------
17:12:02 INFO  OmfEc: APP_EVENT STDOUT from app iperf_cxt_0 - msg: TCP window size: 85.3 KiByte (default)
17:12:02 INFO  OmfEc: APP_EVENT STDOUT from app iperf_cxt_0 - msg: Server listening on TCP port 5200
17:12:02 INFO  OmfEc: APP_EVENT STDOUT from app iperf_cxt_0 - msg: ------------------------------------------------------------
17:12:03 INFO  Object: Client has started now...
17:12:03 INFO  OmfEc: APP_EVENT STARTED from app iperf_cxt_1 - msg: env -i /usr/bin/oml2-iperf -c 192.168.0.3 -p 5200 -t 30
17:12:04 INFO  OmfEc: APP_EVENT STDOUT from app iperf_cxt_0 - msg: [  4] local 192.168.0.3 port 5200 connected with 192.168.0.2 port 37677
17:12:05 INFO  OmfEc: APP_EVENT STDOUT from app iperf_cxt_1 - msg: ------------------------------------------------------------
17:12:05 INFO  OmfEc: APP_EVENT STDOUT from app iperf_cxt_1 - msg: TCP window size: 23.5 KiByte (default)
17:12:05 INFO  OmfEc: APP_EVENT STDOUT from app iperf_cxt_1 - msg: Client connecting to 192.168.0.3, TCP port 5200
17:12:05 INFO  OmfEc: APP_EVENT STDOUT from app iperf_cxt_1 - msg: ------------------------------------------------------------
17:12:05 INFO  OmfEc: APP_EVENT STDOUT from app iperf_cxt_1 - msg: [  3] local 192.168.0.2 port 37677 connected with 192.168.0.3 port 5200
17:12:34 INFO  Object: All my Applications are stopped now.
17:12:34 INFO  OmfEc::Experiment: Experiment: 2015-06-01T15:11:56.496Z finished
17:12:34 INFO  OmfEc::Experiment: Release applications and network interfaces
17:12:34 INFO  OmfEc::Experiment: Exit in 15 seconds...
17:12:38 INFO  OmfEc: APP_EVENT STDOUT from app iperf_cxt_1 - msg: [  3]  0.0-30.5 sec  20.8 MiBytes  5.72 Mbits/sec
17:12:38 INFO  OmfEc: APP_EVENT EXIT from app iperf_cxt_1 - msg: 0
17:12:38 INFO  OmfEc: APP_EVENT STDOUT from app iperf_cxt_1 - msg: [ ID] Interval       Transfer     Bandwidth
17:12:43 INFO  OmfEc: APP_EVENT EXIT from app iperf_cxt_0 - msg: 0
17:12:43 INFO  OmfEc: APP_EVENT STDOUT from app iperf_cxt_0 - msg: [  4]  0.0-30.6 sec  20.8 MiBytes  5.69 Mbits/sec
17:12:43 INFO  OmfEc: APP_EVENT STDOUT from app iperf_cxt_0 - msg: [ ID] Interval       Transfer     Bandwidth
17:12:48 INFO  OmfEc::Experiment: OMF Experiment Controller 6.1.1 - Exit.
17:12:49 INFO  XMPP::Communicator: Disconnecting...
Accesing Results
If all went smoothly, all the results have been saved in a database named after your experiment name (here 2015-06-01T15:11:56.496Z - to kow what is your experiment name look for OmfEc::Experiment: Experiment: in experiment output) on the oml server you defined while executing the omf_ec command.
Postgres database for our oml server is accessible via phppgmyadmin web interface: nitlab.inf.uth.gr/phppgadmin/ with user “oml” and password “oml”. Navigate to this link and see your results stored in database!